
Heat maps present statistics differently than other tools. Heat maps detect groupings of comparable data using similar colors. These will show how this information relates to other parameters and aid decision-making. Colors assist in breaking down information, and intensity indicates activity, while cooler colors imply less. Patterns indicate changes across various factors. Heat maps provide a visual description of the data by converting data into a visual format.
Traffic, user clicks, and performance are just some of the metrics that may be monitored and reported on by a website tracking tool (e.g., conversion rate). Information gleaned from tracking technologies can be used to assess a website's strengths and weaknesses to serve users better and achieve business objectives.
If you're new to website tracking or want more information than what's provided by standard traffic statistics, you'll find everything you need here.
1. Crazy Egg
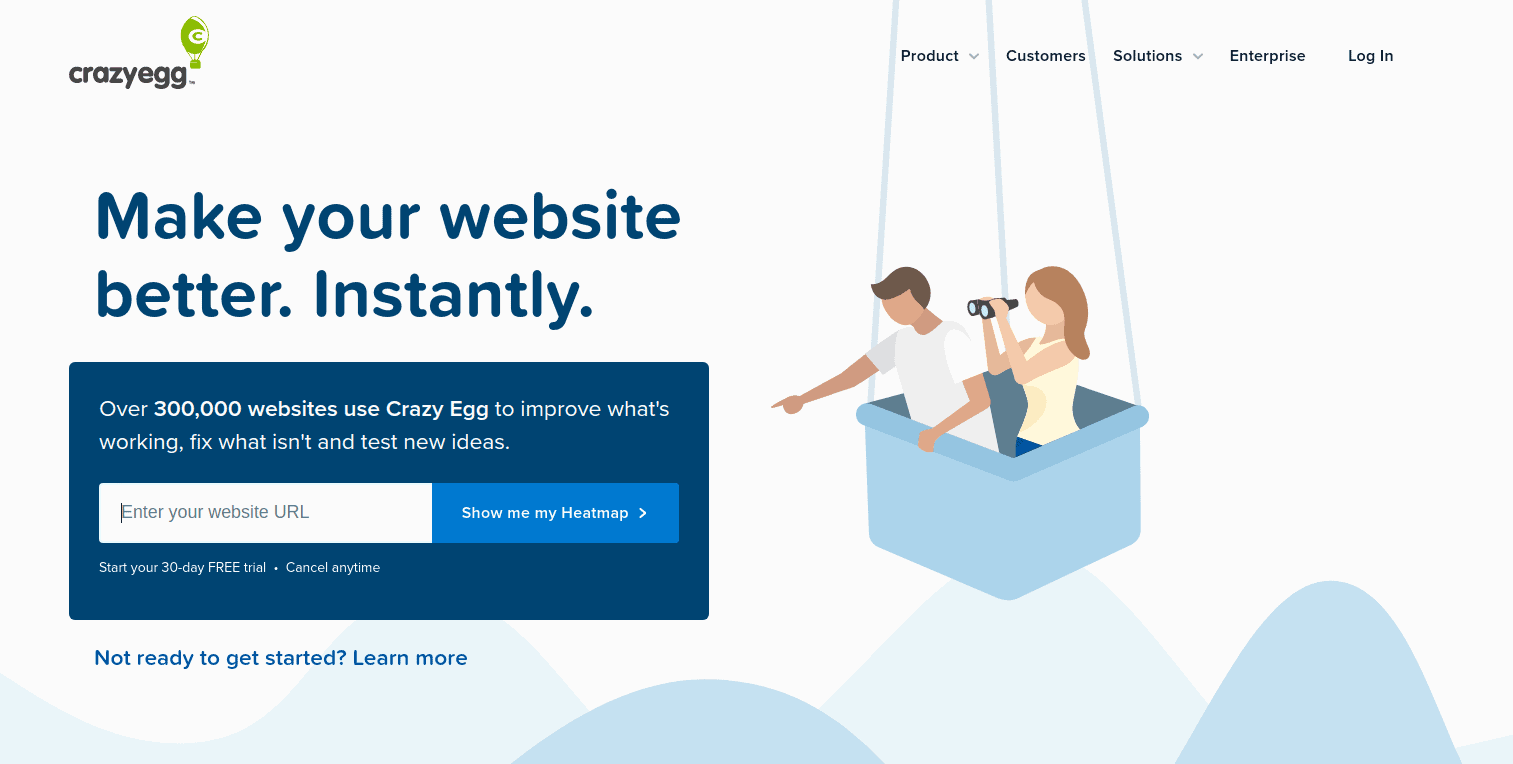

To put it simply, Crazy Egg is a tool that can be used to test and map user behavior on a website. It's available as a WordPress plugin and uses a confetti heat map to reveal where visitors are clicking. Its color-coded stats make it easy to see the origin of a visitor or the website that sent them to yours. In addition, you can conduct as many A/B tests as you like using Crazy Egg to see which variations your visitors prefer. You can then make well-informed choices about the specific adjustments to your site that you wish to implement. Click heat maps, mouse pointer heat maps, and scroll heat maps are all supported. Every package has a risk-free trial period of 30 days.
2. Feng-GUI
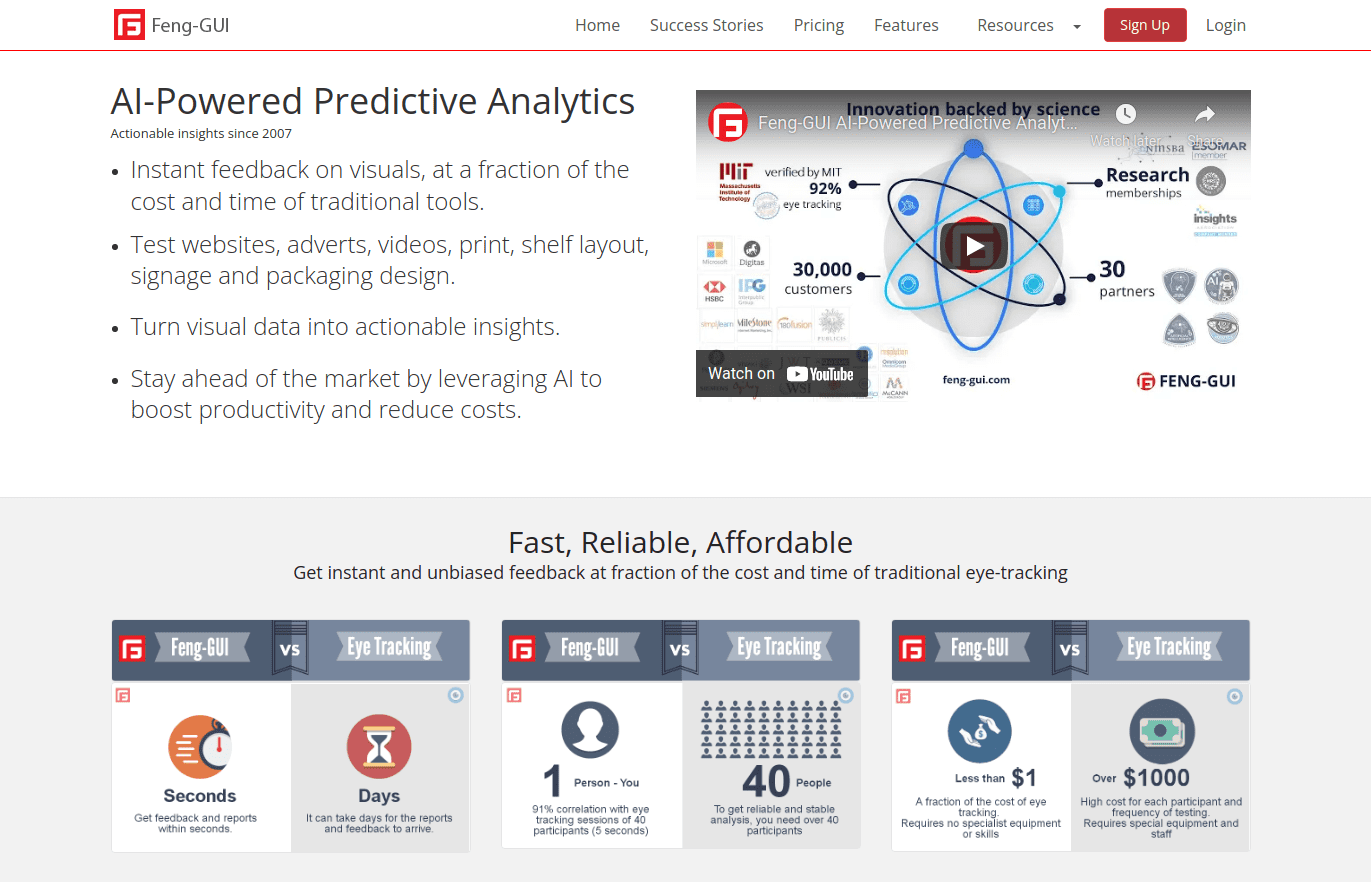

Compared to similar tools, Feng-GUI stands out because of its use of AI in the form of predictive eye movements to deliver insights on any imagery. Heat maps, gaze plots, interest zones, transparency, and visual appeal are all examples. Landing pages, advertisements, banners, and even package designs can benefit the platform's heat map tools. Since it is based on algorithmic models, it provides instantaneous results. There is also a free plan available that includes one month of analysis at no cost.
3. EyeQuant
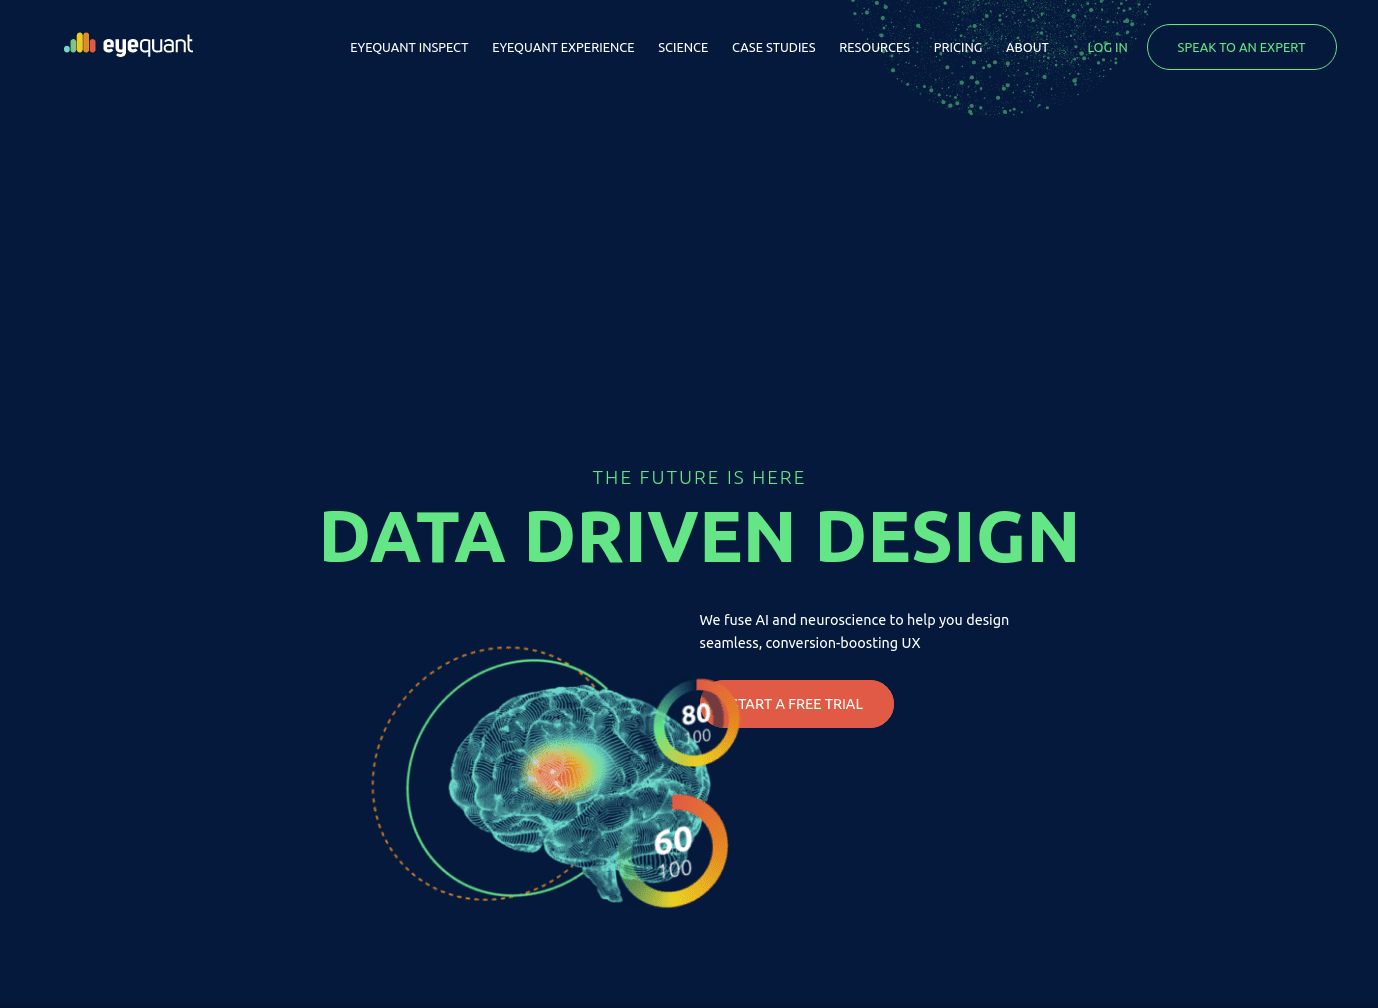

EyeQuant employs AI to foretell how people will respond to digital designs. This heat map provides immediate feedback on the visual attention analysis, including details like clarity and emotional effect. To ensure the privacy of its users, the heat map complies with the General Data Protection Regulation (GDPR). While EyeQuant does not have a set monthly subscription fee.
4. Hotjar
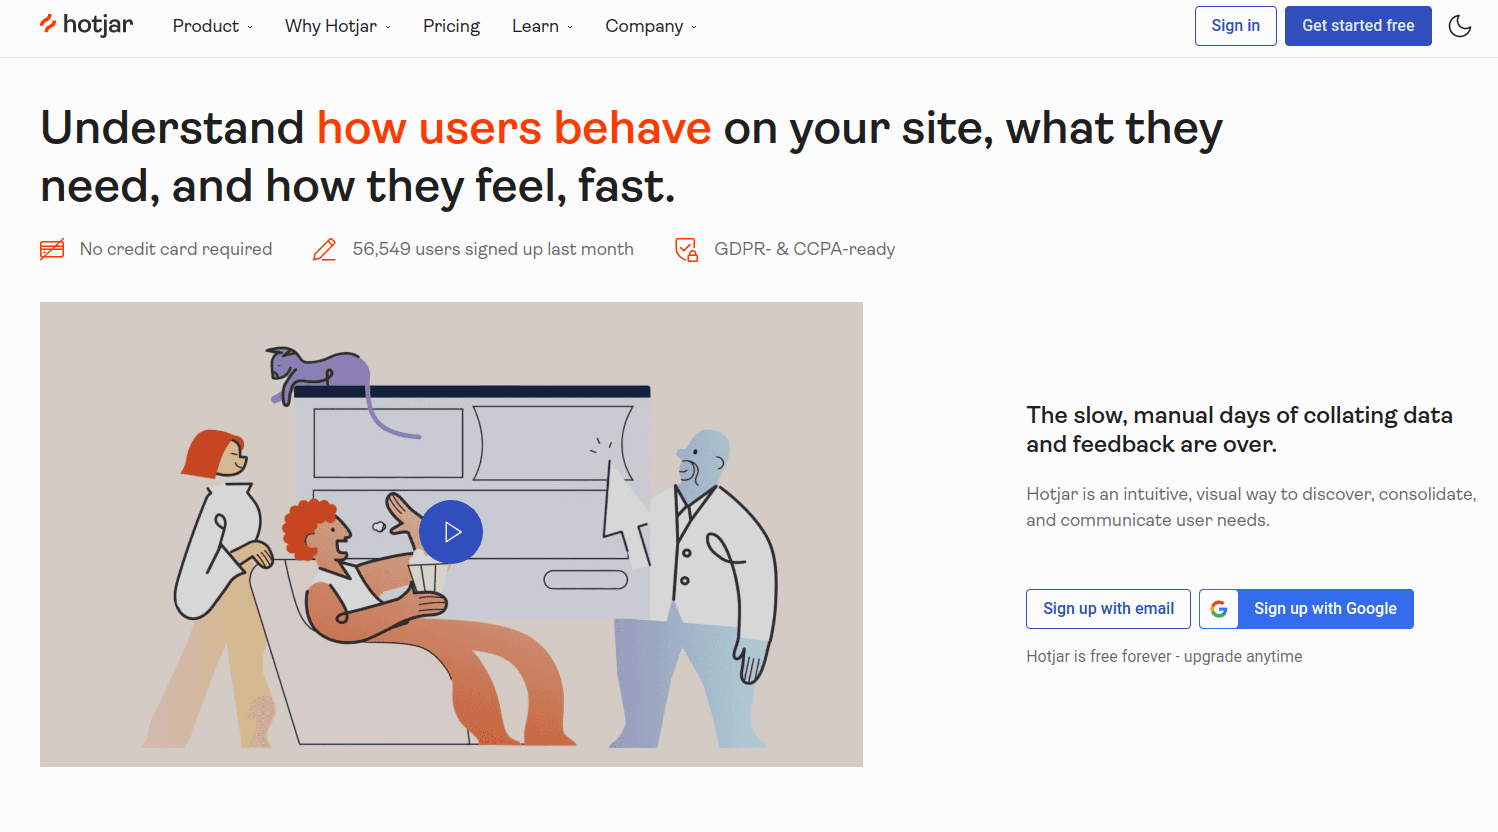

Hotjar is a cloud-based service that monitors and records user interactions with your website. Hotjar's capabilities allow you to monitor user actions like mouse movements, taps, and scrolling to understand their goals and preferences better. It includes analytics, polls, surveys, and polling tools to help increase conversions and user engagement. There are all captured by Hotjar's heatmaps, allowing you to see where your site or app could use improvement. The free plan only allows 2,000 page views per day and has restricted reporting capabilities.
5. FullStory
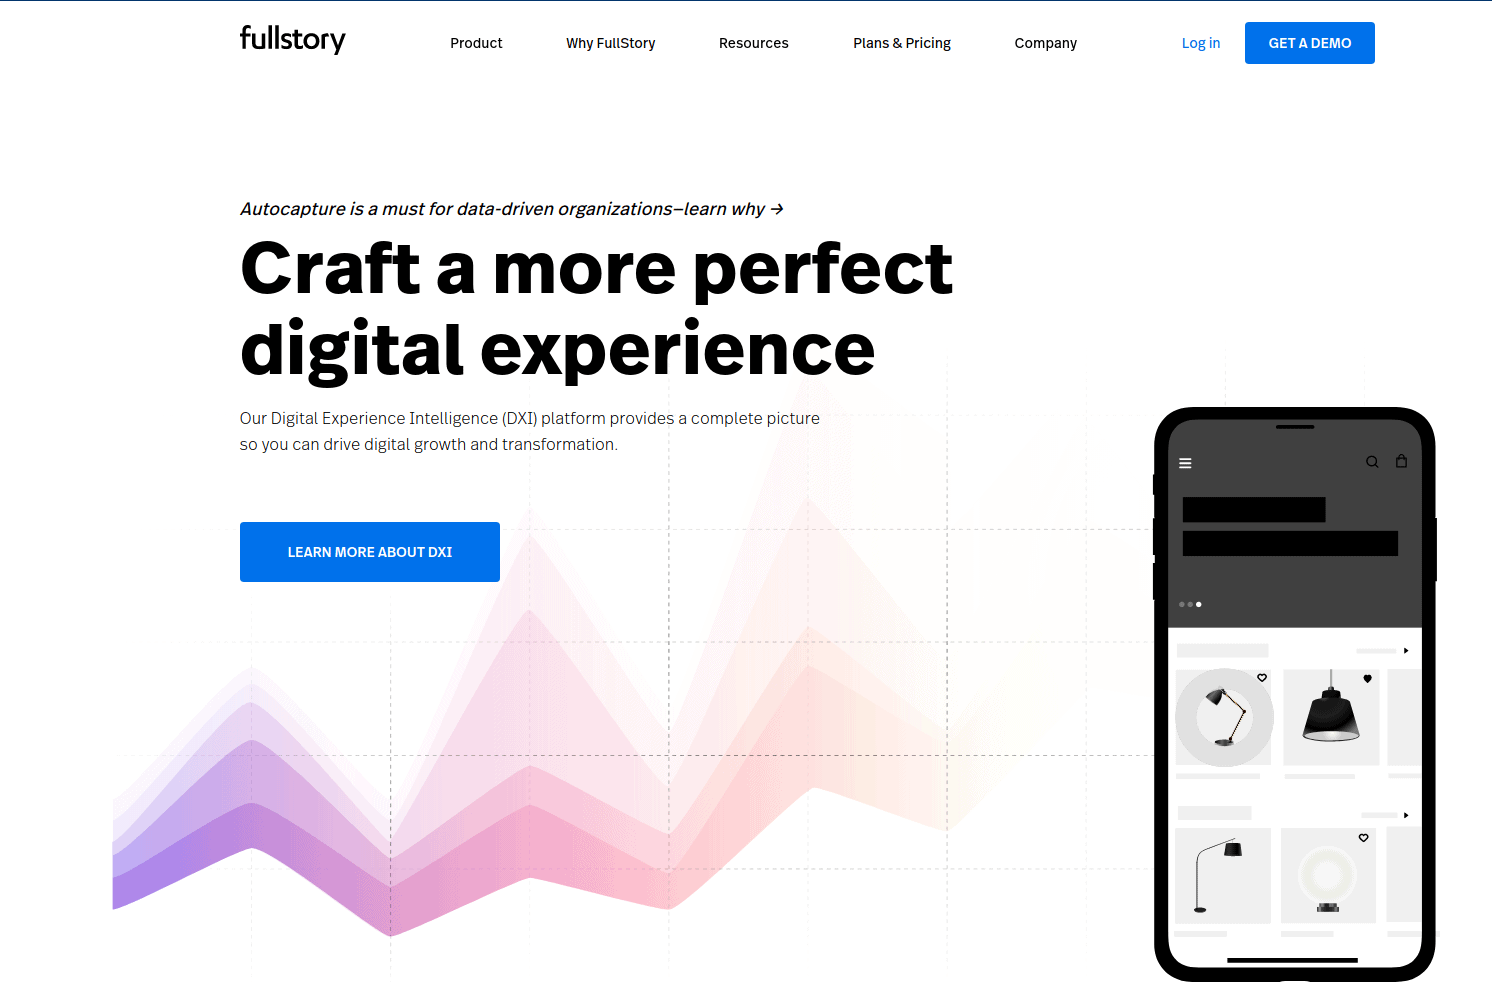

An effective user digital experience analytics solution is included in FullStory. Everything you need to know to guide your users through your conversion funnel is laid out for you. Heatmaps, session replays, error reporting, and other helpful features are included. Also, it has a co-browsing feature, so your chat support staff can observe and interact with users in real-time, helping them out with any problems they may be having. FullStory provides free analytics for 14 days throughout the trial period
6. Quantum Metric
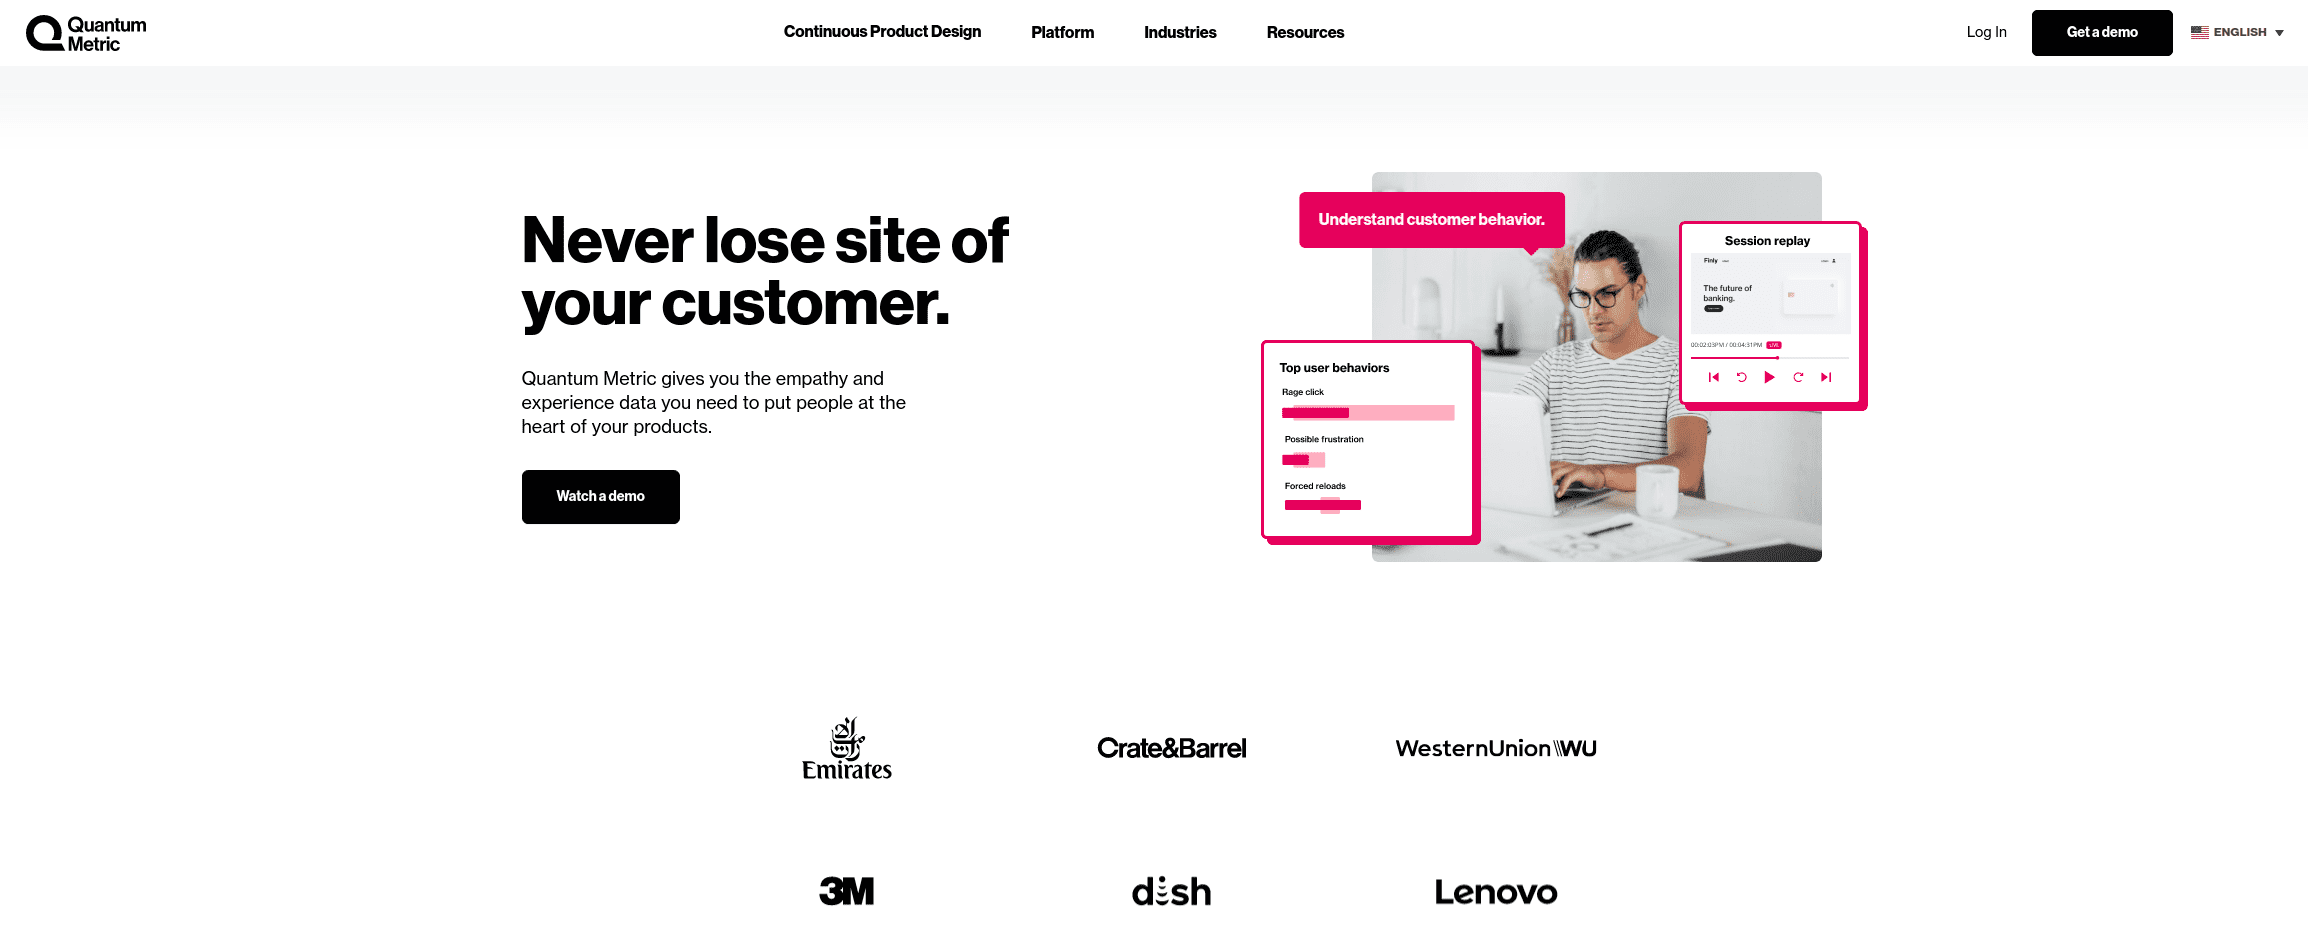

To help you find ways to improve your site's performance, Quantum Metric employs statistical analysis and machine learning. With this useful tool, you can quickly optimize your conversion funnel, single out conversion-blocking elements, and highlight successful advertising campaigns. Businesses may now select opportunities based on business impact and coordinate with team-based dashboards thanks to real-time cross-team synchronization features.
7. Lucky Orange
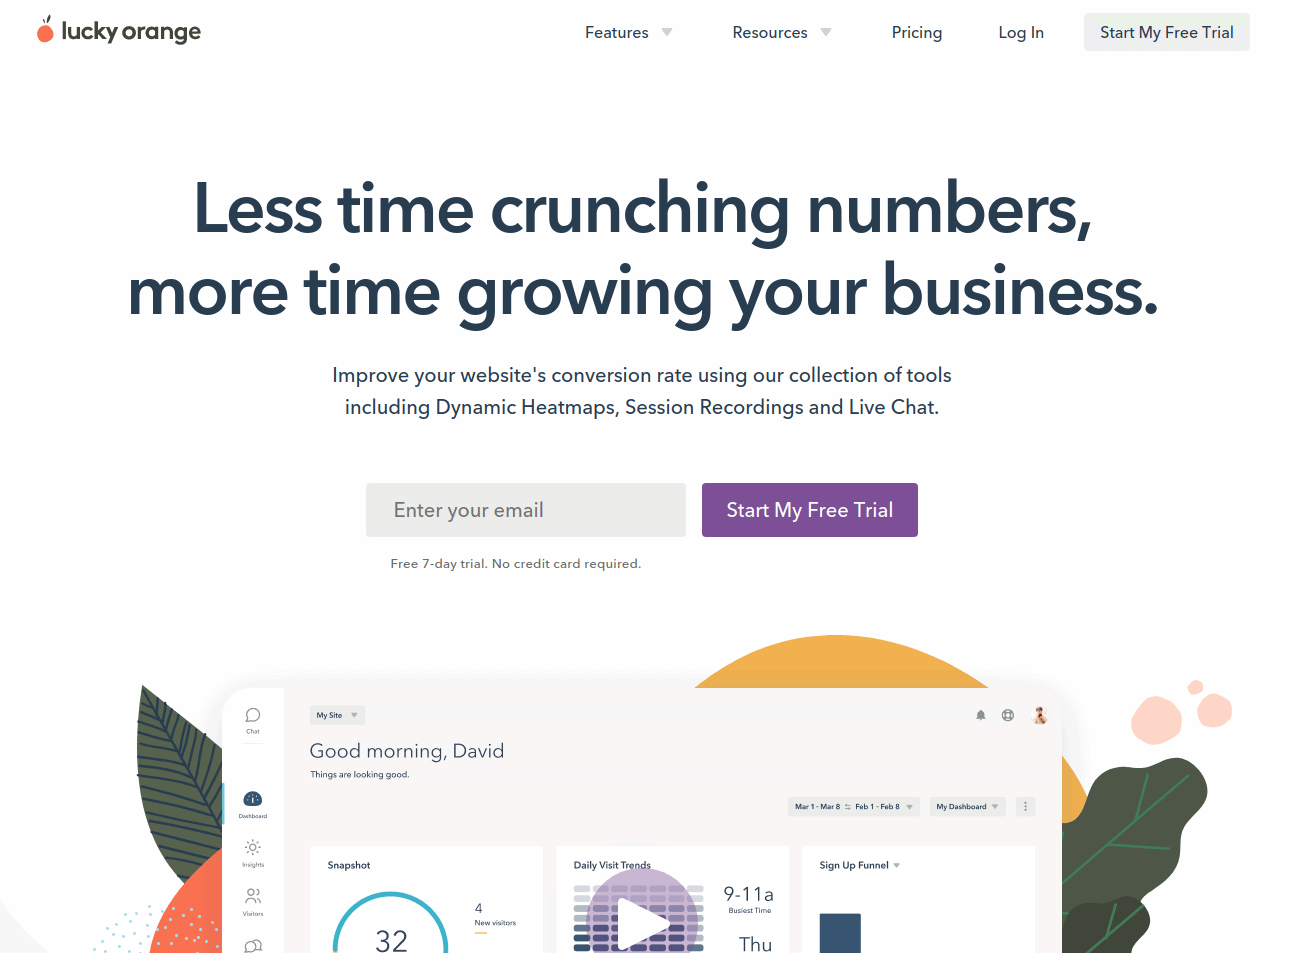

Funnel analytics, heat maps, session recordings, and polls are just some of the tools that Lucky Orange gives you to figure out how users act. On your website, user activities involve taps, moves, clicks, and scrolling. This is backed up by advanced data processing and filtration features that help you get all the responses you need to plan your tests.
8. Mouseflow

An alternative to CrazyEgg and Google Analytics, Mouseflow creates heat maps to track users' mouse movements and focus. Dropouts, refills, blank submissions, mistakes, and a whole lot of other user actions are all tracked as well. In addition, it displays a de-identified log of each user's interactions with your website.
9. Smartlook

Heat maps and session replays are two of the many features offered by Smartlook that allow you to see your users' journey from the moment they land on your website. Ultimately, you want them to visit your website again and convert by clicking on your Facebook retargeting ad. Integrating with Smartlook is as simple as adding some code to your website.
10. Zoho PageSense

Using the heat map created by the Zoho PageSense tool, you can monitor user activity and improve your website's analytics, which in turn should increase conversions. Its simple features can track things like how far down a page a user scrolls or where they focus their attention. You can utilize the predefined segments provided by Zoho, or make your own custom filter, to display the actions of a subset of your users in the filtered report.